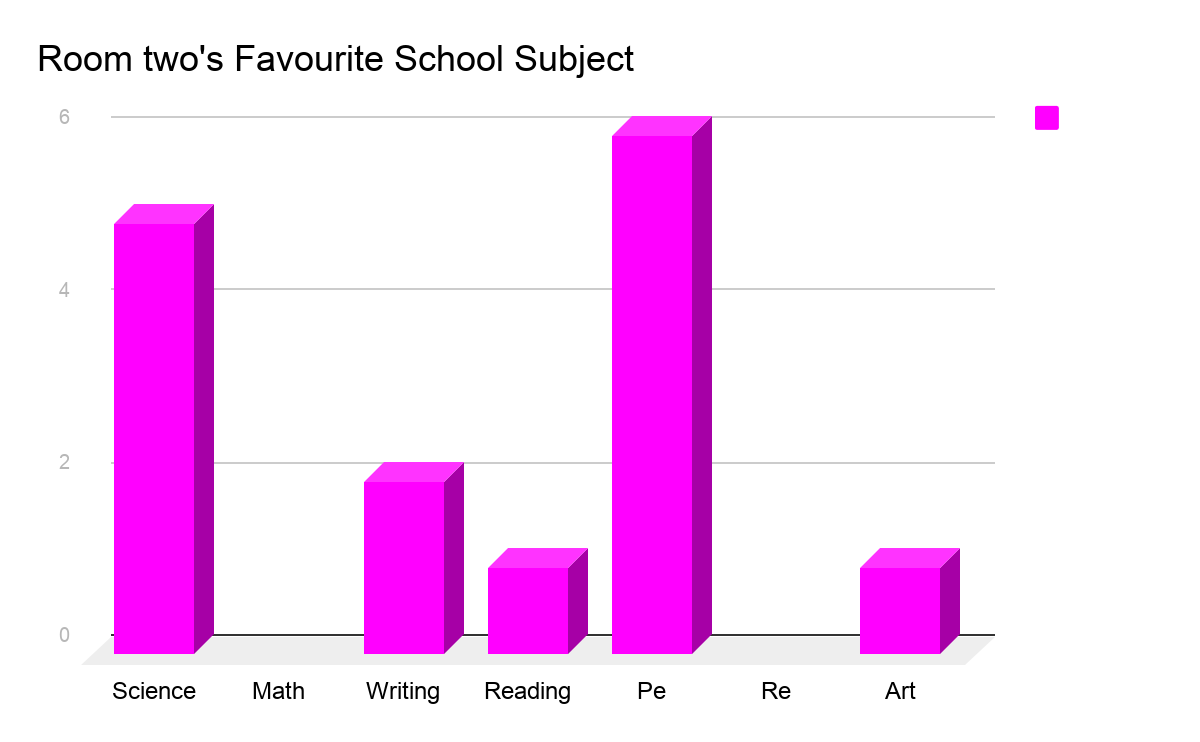
What had the most? Pe 6
What had the least? Re and Math 0
What was the difference between the most and the least amount? 6
How many people did you collect data from? 15
How might you use your data? To see what room two’s favourite school subject is.
Challenge: Create your graph below using insert, chart, column